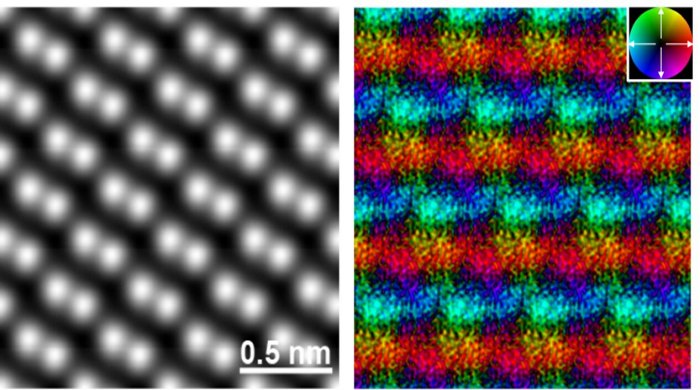
Figure 1. Real-space magnetic field image of an antiferromagnetic a-Fe2O3The atomic structure image (left) and corresponding magnetic field image (right). In the atomic structure image, Fe atoms are visualized as bright spots. In the magnetic field image, the color contrast indicates the magnetic field orientation and strength. The inset color wheel indicates how color and shade denote the magnetic field orientation and strength in the vector color map. The antiparallel magnetic fields on the adjacent Fe atomic layers are clearly observed, visualizing antiferromagnetic order in this crystal. Credit: Naoya Shibata
Physics

Visualization Of Magnetic Forces’ Origin By Atomic Resolution Electron Microscopy

Eddie Gonzales Jr. – MessageToEagle.com – The joint development team of Professor Shibata (the University of Tokyo), JEOL Ltd. and […]